

- Analysis
- 7 min read
Underhoused, Again: U.S. Housing Construction Has Dropped Sharply, Especially in the South
The recent sharp decline in housing starts is a worry not just for the state of the overall economy (housing construction can be both a warning sign for and a consequence of macroeconomic weakness) but also for the ability of our populace to find one of the most basic necessities—housing—near enough to another basic necessity—work—to keep the economy moving.
The COVID shutdown woke the country up—briefly—from a long-term housing shortage. People who had suddenly lost their jobs, or who were working from home for the first time, decided to make changes not only in their housing situation but even in their hometown, resulting in a massive shift in housing demand. Construction starts on new housing units surged by +27 percent from just 1.3 million in 2019 to almost 1.7 million in 2021.
The tide crested quickly, though: only 1.4 million units were started in 2024 (a drop of -15% compared with 2021), and the first five months of 2025 have been showing even fewer.
Much more troublesome, the decline in housing starts has been concentrated in the multifamily part of the market, where young adults find space to form new households and begin new lives. Single-family starts—those generally serving older, wealthier, more established households—declined by less than -12 percent from 2021 (their peak year) to 2024. Multifamily starts peaked slightly later, in 2022, but then plummeted three times as dramatically, by a whopping -35 percent.
Multi-Decade Decline, Especially for Multifamily Construction
If the drop in housing construction were merely a short-term blip then it wouldn’t be cause for worry. The aberration, though, was the 2021-22 peak: the truth is that the development of new housing to serve new households has been in freefall for more than 50 years.
At the beginning of 1972 there were 66 million households in the U.S. This year there are 132 million: the number of households has increased by +100 percent. The first quarter of 1972 saw 2.4 million new housing units were started (at an annualized pace). This year we’re on pace for 1.4 million: the number of housing starts has shrunk by -42 percent.
Put another way, in early 1972 housing starts equaled 3.6 percent of the number of households, but in early 2025 they’ve equaled just 1.1 percent—an astonishing decline of -71 percent.
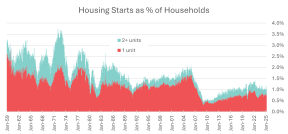
Again, the decline in housing starts has been concentrated in the part of the market serving young adults just beginning to form households: from early 1972 to early 2025 the number of single-family homes started (as a percentage of households) declined by -61 percent, while the number of multifamily homes started declined by -82 percent.
Migration: Housing Undersupply is Especially Bad in the South
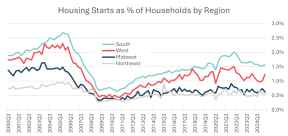
For most of our country’s history, people have been leaving the Northeast region (and, more recently, the Midwest) to form new households in the South and West. That hasn’t changed, but the South has become an even greater draw: since the beginning of this century the number of households in the South has increased by 42 percent, compared with just 34 percent in the West, 17 percent in the Midwest, and 16 percent in the Northeast. (The U.S. Census Bureau defines the South region to encompass Maryland, Delaware, DC, Virginia, West Virginia, Kentucky, Tennessee, North & South Carolina, Georgia, Florida, Alabama, Mississippi, Arkansas, Louisiana, Oklahoma and Texas.) Put another way, the South region has added 15.2 million households over the past 25 years, more than the rest of the country combined.
That outsized growth in the number of households means that more housing needs to be built in the South: people in the Northeast and Midwest can simply move into homes that others have vacated, where people in the South need new places to live because the existing ones simply aren’t being abandoned as readily. But housing starts have been declining in the South, too: starts equaled 1.9 percent of households in 2000 but over the past year they’ve equaled just 1.6 percent, a decline of -18 percent in the past quarter-century relative to the number of households. (Even during 2005, at the height of what we might call a housing construction “boomlet,” starts in the South equaled just 2.6 percent of households—small potatoes compared with what was normal a half-century ago.)
Moreover, even in the South region, where so many young adults move to form new households and begin new lives, multifamily has borne the brunt of the recent decline: from 2022 to 2024 multifamily starts in the South collapsed by -35 percent, compared with a milder decline of just -11 percent (from 2021 to 2024) for single-family starts.
If There’s a Silver Lining, It’s Only for Property Owners
Supply and demand determine price.
For more than five decades, demand for housing—especially multifamily housing, and especially in the South region—has been growing more rapidly than supply.
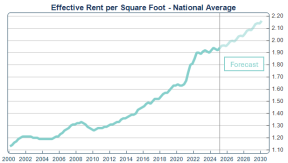
Perhaps the best general measure of the price of rental housing is “effective rent per square foot,” because it controls both for concessions (such as a free month) and also for increases in apartment size. Effective rent per square foot sometimes languishes (such as in 2002-06 when many renters were trying their luck with homeownership, as well as in 2023-24 when multifamily supply was surging) and at other times increases rapidly (such as in 2006-07 when many homebuyers were being evicted during the nationwide mortgage crisis, as well as during the covid shutdown). Over the past quarter-century effective rent per square foot has increased at an average of 2.2 percent per year—surprisingly, less than the overall rate of inflation at 2.6 percent per year.
During the past two years (2022Q2-2025Q1) the national-average effective rent per square foot increased by just 0.6 percent per year in response to the earlier surge in housing starts. As a result of the more recent drop in starts, though, I forecast that rents will increase over the next five years at a return to the long-term average rate of 2.2 percent per year.
That’s good news for housing developers: rents increasing at more than 2 percent per year make it more likely that the a new rental housing community will bring in enough revenue to offset the costs and risks to build and operate it.
Both demand growth and supply growth are local, however, so a nationwide rent growth forecast is not very helpful to developers looking to address supply/demand imbalances. Local forecasts are much more powerful:
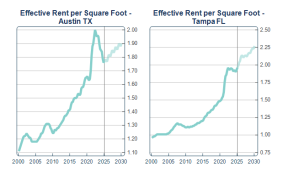
- Austin, Texas is an example of a market that has seen strong in-migration and therefore strong demand growth, but the surge in new housing construction following the covid shutdown was so exaggerated (and has not yet ended) that I forecast growth in effective rent over the next five years at a paltry 1.4 percent per year—and I forecast that rents in early 2030 will still be about five percent lower than they were at Austin’s peak in 2022Q2.
- On the other hand Tampa, Florida is an example of a market that did see strong demand growth (though not as strong as in Austin) but saw nothing like Austin’s new housing construction flood. As a result, I forecast that growth in effective rent over the next five years will be more than twice as high in Tampa as in Austin at a very strong 3.0 percent per year—and I forecast that rents in early 2030 will be almost 16 percent higher than they are today.
I will be updating these forecasts, of course, typically every quarter using the latest data on housing starts as well as other predictive indicators such as newly issued building permits, employment growth, and vacancy rates. Better-quality forecasts at the local level can be the difference between successfully targeting new communities and mistakenly building a project that languishes for lack of tenant demand.
Related Content
The New Missing Middle: How BTR Is Filling the Affordability Gap
Amid market softening, BTR remains a critical solution to ongoing affordability challenges in the housing market.
New Construction Business Opportunities in the Multifamily Sector
The multifamily sector is navigating a rare convergence of market pressures, which is why Middleburg is taking a different approach—one...
The Long Runway for Rental Housing Demand: Why Middleburg CEO Chris Finlay is Optimistic About...
Insights from Chris Finlay on the long-term demand for rental housing.